I had the privilege of working on a project for Great Learning’s Corporate Academy to create a dashboard that enables corporate offices to manage their employees’ learning environment.
The goal of this project was to develop a tool that allows the organization to optimize its training programs and ensure that employees are learning the skills they need to succeed. The proposed dashboard provides insightful analytics to track progress, a leaderboard to recognize top performers, and administrative functions to manage the training program effectively.
Through this project, I had the opportunity to utilize my skills in UX/UI design, information architecture, and data visualization to deliver an effective and user-friendly solution that met the business and client’s requirements. I am excited to share my design process and the final outcome of this project as a testament to my design skills and problem-solving abilities.
Business Goal
Create a Dashboard for Great Learning Corporate Academy that enables corporate offices to manage their employees’ learning environment. The Dashboard will provide analytics, a leaderboard, and administrative functions.
Problem Statement
Great Learning Corporate Academy needed a tool to enable corporate offices to manage their employees’ learning environment.
Currently, there is no effective way to track the progress of employees across the organization, and there is a lack of visibility into which courses are being completed, how long it takes employees to complete them, and which courses are the most popular.
This lack of insight makes it difficult for the organization to optimize its training programs and ensure that employees are learning the skills they need to succeed.
The proposed Dashboard will provide the necessary analytics to track progress, a leaderboard to recognize top performers, and administrative functions to manage the training program effectively.
Design Process
Step 1: Competitor analysis
My design process began with a competitor analysis to gain a better understanding of the market and identify potential design opportunities. As LinkedIn was our main competitor, I conducted a thorough analysis of its design elements, user interface, and functionality to gain insights into what works well and what could be improved upon
Step 2: Moodboard
Since, I was also responsible for the visual side of the Dashboard, followed by the competitor analysis, I moved onto moodboarding to establish the visual direction of the project. I created a collection of visual assets, color palettes, typography, and imagery that would inform the overall design direction for the dashboard. This helped to establish a cohesive and consistent look and feel for the project.
Step 3: Low-fidelity wireframes

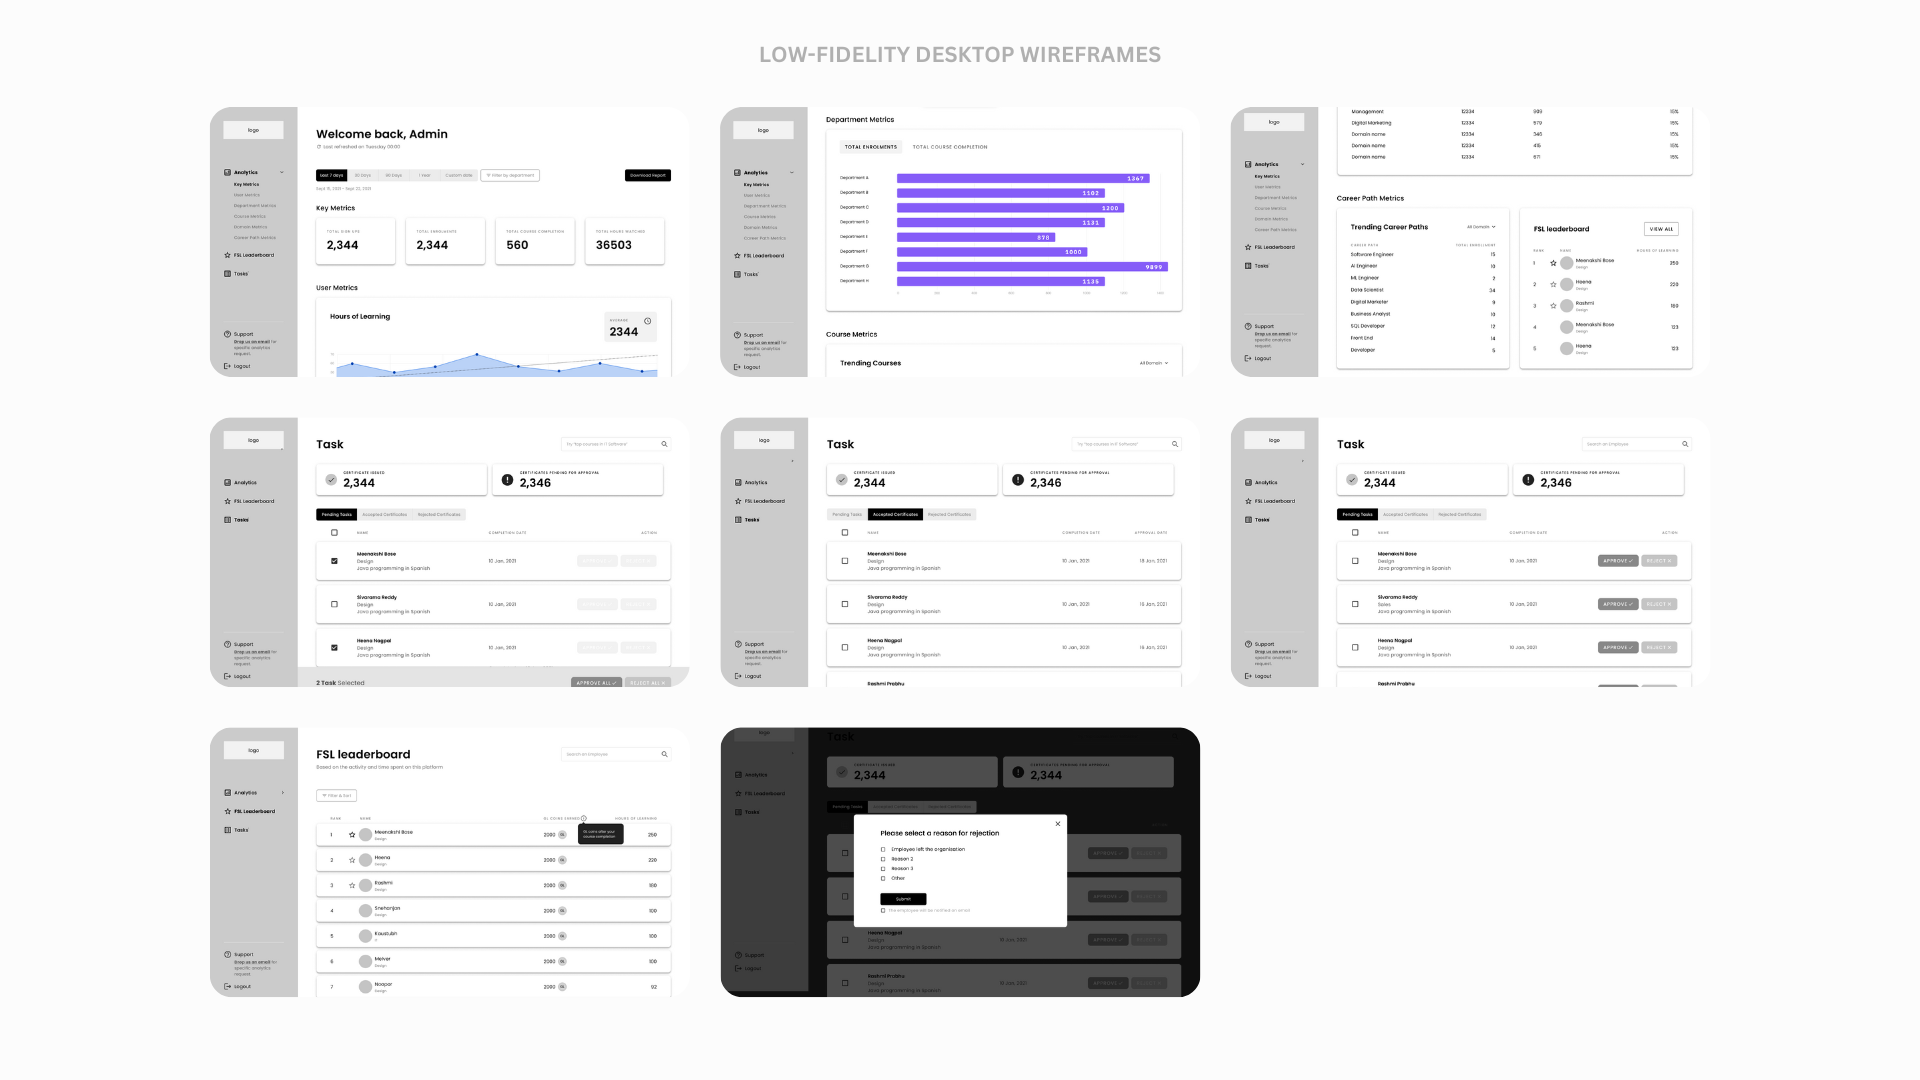
Next, I worked on the low-fidelity wireframes that served as the foundation for the project’s design. The wireframes went through two iterations, allowing me to refine the overall layout and functionality of the dashboard. This helped to establish the basic structure of the dashboard and how the different sections and elements would be organized.
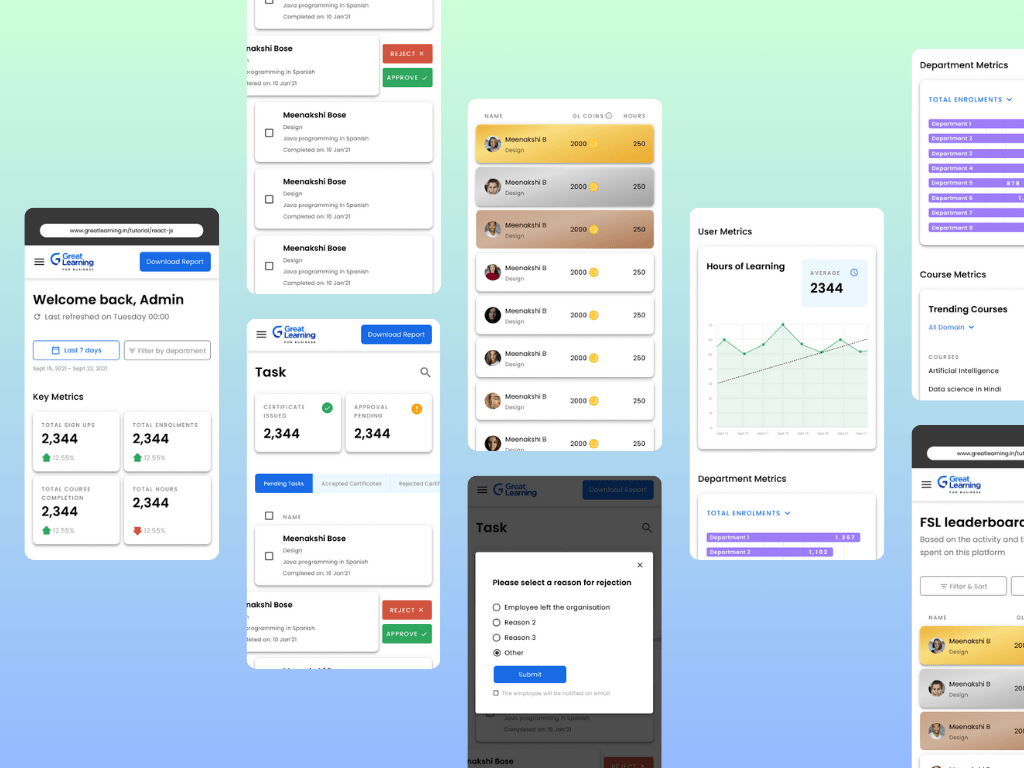
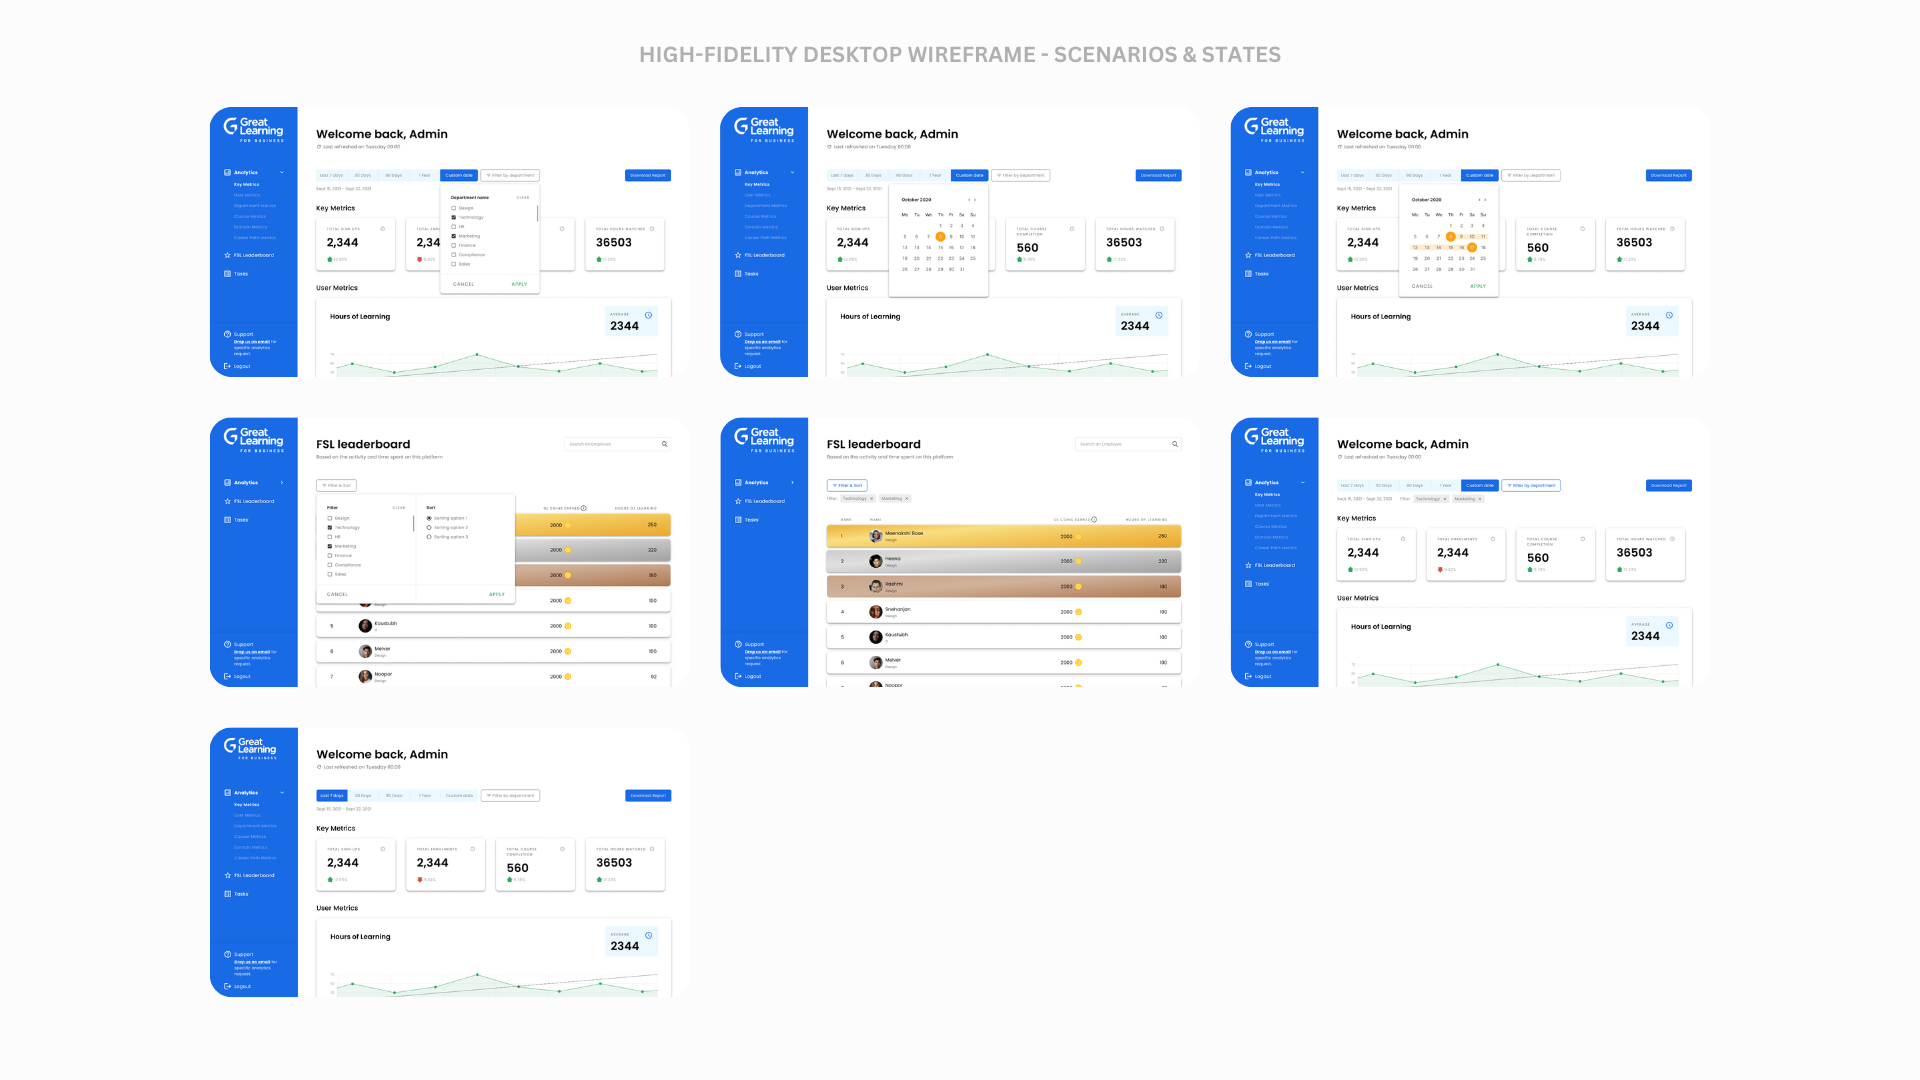
Step 4: High-fidelity wireframes

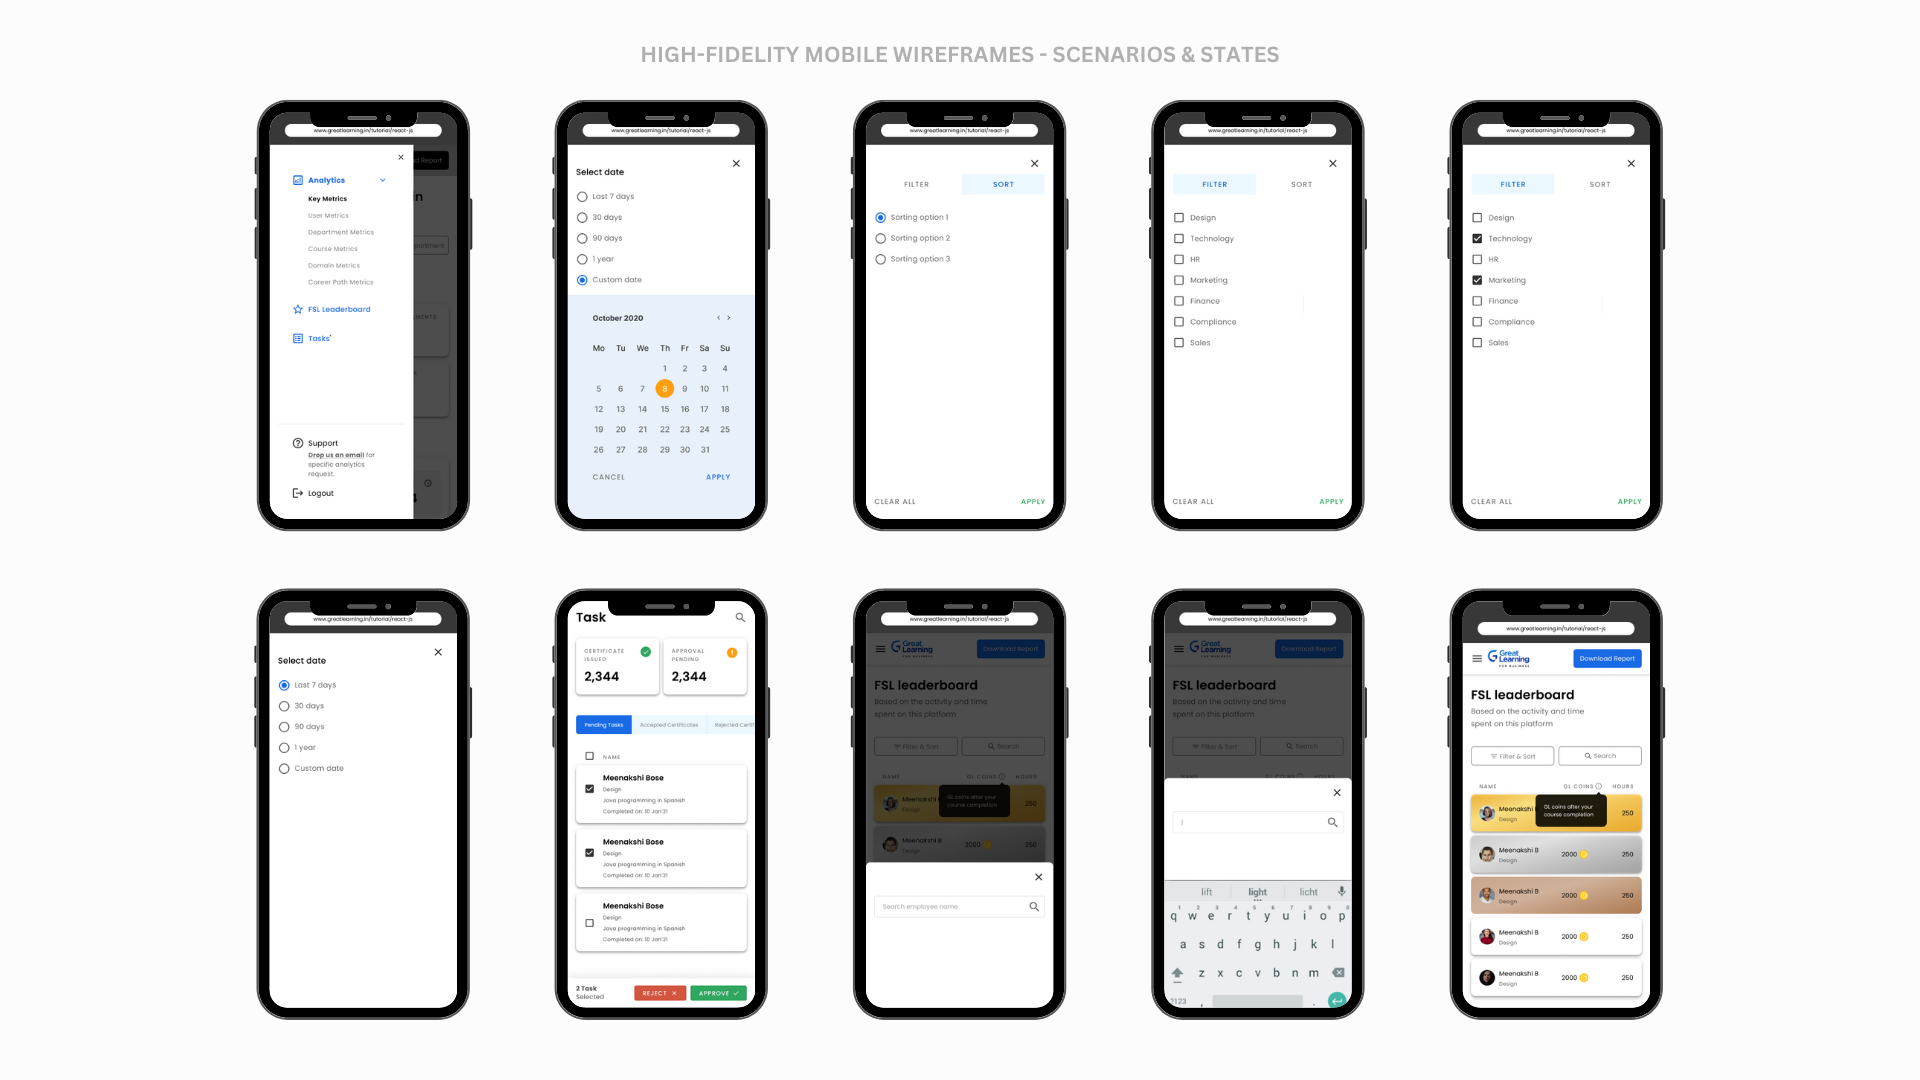
After finalizing the wireframes, I moved onto the high-fidelity design phase, which involved creating detailed visual designs for the dashboard. This phase went through two iterations, allowing me to refine the visual design and ensure that it aligns with the project’s goals and requirements. This helped to establish the final look and feel of the dashboard, including typography, color scheme, imagery, and iconography.
Throughout the design process, I maintained open communication with the stakeholders to ensure that the design aligns with their expectations and requirements. This iterative approach to design allowed me to refine the design as I went along and ensure that the final product met the client’s needs while being visually appealing and user-friendly.

Final thoughts
Great Learning Corporate Academy Dashboard project was a challenging yet rewarding experience. Through the design process, we were able to create a tool that enables corporate offices to manage their employees’ learning environment effectively.
The proposed dashboard provides insightful analytics to track progress, a leaderboard to recognize top performers, and administrative functions to manage the training program effectively. Throughout the project, we followed a design process that involved competitor analysis, moodboarding, low-fidelity wireframes, and high-fidelity design iterations. This allowed us to refine the design and ensure that it meets the client’s requirements and expectations.

I am proud of the final outcome of this project and believe that the Great Learning Corporate Academy Dashboard will be a valuable tool for the organization. The Dashboard not only provides the necessary analytics to track progress but also enables the organization to optimize its training programs and ensure that employees are learning the skills they need to succeed. I look forward to seeing the impact that the Great Learning Corporate Academy Dashboard will have on the organization and its employees.

Leave a comment